
The median Canadian DTC merchant in our analysis is overpaying on shipping by 30.7%.
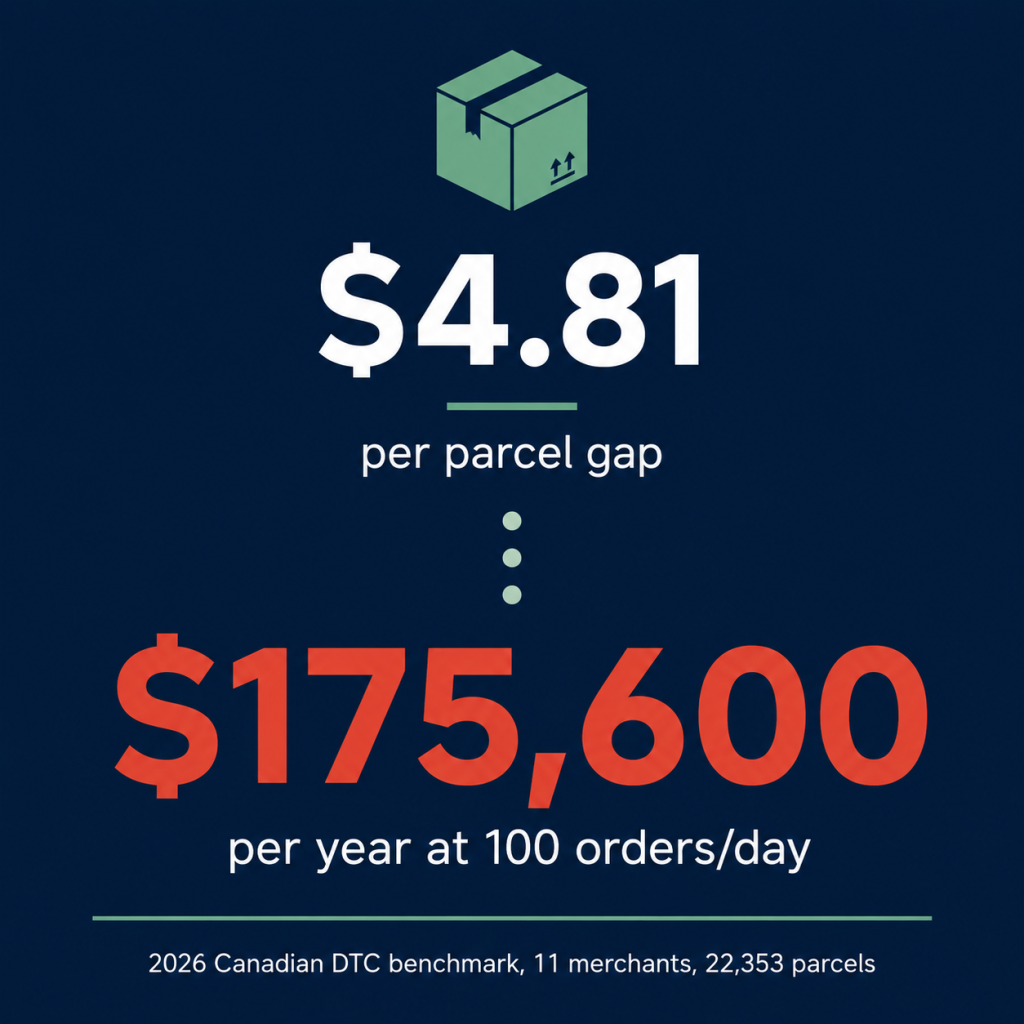
That number comes from 22,353 domestic carrier invoices across 11 merchants, all shipped between January and May 2026. For every parcel, we placed the merchant’s actual paid rate beside the rate that same parcel would have cost through Part n Parcel’s managed carrier program. The merchant-weighted median gap was 30.4%, or $4.81 per parcel ($15.84 paid vs. $11.03 PnP-managed rate).
At Part n Parcel, we manage shipping economics for 240+ Canadian e-commerce businesses. We see every invoice, every carrier, every lane. That visibility is what made this benchmark possible. No public Canadian dataset compares actual merchant-paid parcel rates to a verified alternative quote on the same shipment. The existing evidence base stops at surveys, list-rate guides, and website-based price indices. This is the first parcel-level benchmark built entirely from real paid invoices.
The per-merchant range ran from 10.2% to 71.7%. For a merchant shipping 100 orders per day, the median gap translates to roughly $175,600 per year in margin walking out the door. At 50 orders per day, that figure is approximately $87,800.
This article publishes the full dataset: by weight band, by lane, by carrier, and by shipment configuration. If you ship at meaningful volume in Canada, these are the numbers your invoices should be measured against.
Why the Gap Exists and Why It Compounds
These merchants did not choose the wrong carrier. Most were on reasonable carriers with negotiated rates. The gap is structural.
Carriers do not publish prices. Every merchant negotiates their own rate card in isolation, with no reference point for what comparable shippers are paying on the same lanes, at the same weights, with the same service levels. Two businesses shipping identical volumes from Ontario to British Columbia can be paying materially different rates. Neither will ever know. In a market with no price transparency, the most informed party wins. That party is the carrier.

This is where unmanaged accounts quietly bleed margin. A merchant who negotiated rates two years ago has watched those rates compound through annual General Rate Increases (GRIs) without a corresponding re-negotiation. Surcharge tables have shifted. Dimensional weight calculations have been recalibrated. The carrier mix has drifted. None of this shows up as a single large expense. It shows up as a slow, invisible widening of the gap between what they pay and what they could pay with actively managed carrier economics.
If you don’t own and actively manage the carrier account that determines your rates, the leakage compounds every invoice cycle. An account that was competitive two years ago is almost certainly not competitive today. And without a benchmark, there is no way to know how far it has drifted.
If you don’t own and actively manage the carrier account that determines your rates, the leakage compounds every invoice cycle. An account that was competitive two years ago is almost certainly not competitive today. And without a benchmark, there is no way to know how far it has drifted. Closing that gap isn’t a matter of shipping more. It comes down to the account structure your rates sit on, which is the real story behind how a Canadian small business actually reaches enterprise rates.
Every number in this report traces back to that dynamic. The weight band gaps, the lane-level differences, the multi-piece configuration errors: all of them reflect what happens when carrier accounts run without continuous management, benchmarking, and routing discipline.
The Benchmark at a Glance
| Cut | Merchant Paid (Median) | PnP-Managed Rate (Median) | Gap | n (Parcels) | M (Merchants) |
| All parcels | $15.84 | $11.03 | 30.4% | 22,353 | 11 |
| Inter-province | $28.02 | $12.80 | 54.3% | 9,360 | 11 |
| Intra-province | $13.62 | $9.28 | 31.9% | 12,294 | 11 |
| Multi-piece shipments | $58.34 | $24.70 | 57.7% | 507 | 6 |
| Single-piece shipments | $15.81 | $11.03 | 30.2% | 21,846 | 11 |
The 30.7% figure is the median merchant savings opportunity: the middle merchant in the cohort would have paid 30.7% less through the managed program. The 30.4% in the table is the rate gap, the distance between the merchant-weighted median paid rate ($15.84) and the merchant-weighted median managed rate ($11.03). The methodology section explains why both are reported.
Disclosure: Every PnP-managed rate in this report reflects the standard program rate a merchant would pay through Part n Parcel’s system. These are not PnP’s internal carrier costs, and they are not a higher negotiated tier. They represent what a merchant enrolled in our program would actually pay on each parcel. Cuts with fewer than 3 contributing merchants (M < 3) are omitted to protect anonymity and statistical integrity.
What Canadian DTC Merchants Pay by Weight Band
Weight is the most intuitive cost driver, but the gap between paid and managed rates does not scale the way most merchants expect. Lighter parcels often carry the widest percentage gaps because dimensional weight pricing, minimum charges, and residential surcharges eat up a larger share of the total bill on small shipments.
| Weight Band | Merchant Paid (Median) | PnP-Managed Rate (Median) | Gap (%) | n (Parcels) | M (Merchants) |
| Under 1 lb | $12.68 | $10.52 | 17.0% | 553 | 3 |
| 1 to 2 lb | $16.71 | $12.31 | 26.3% | 1,955 | 7 |
| 2 to 5 lb | $14.66 | $10.28 | 29.9% | 5,511 | 9 |
| 5 to 10 lb | $16.45 | $9.92 | 39.7% | 2,031 | 9 |
| 10 lb+ | $24.44 | $18.70 | 23.5% | 12,303 | 8 |
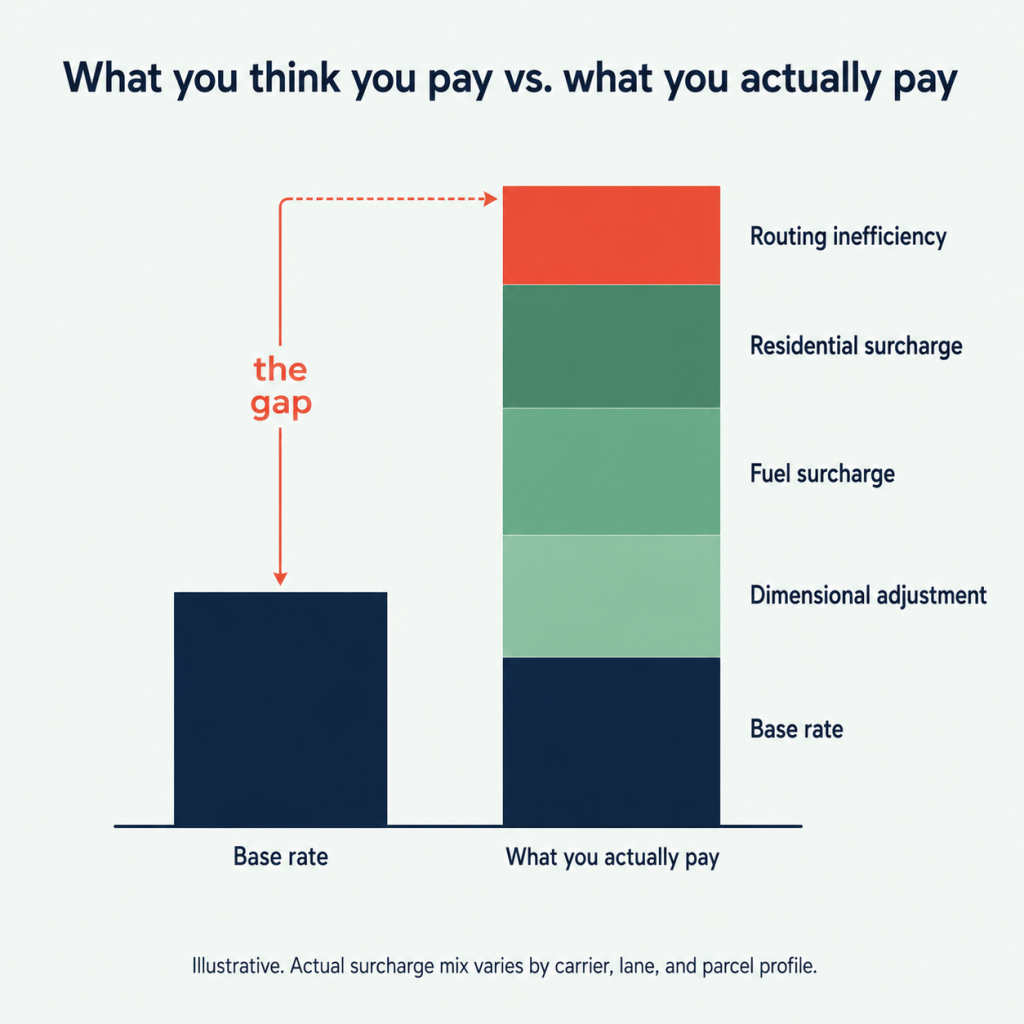
What the weight data tells you: If most of your volume falls in a particular band and you have not benchmarked your per-parcel cost against a managed rate in that range, the gap is almost certainly wider than you think. The carriers’ own rate guides confirm that the quoted transportation rate is only the starting point. FedEx’s 2026 Ground guide instructs shippers to find the zone rate and then add special handling fees, surcharges, and other additional charges. Purolator’s guide directs shippers to review additional service options after determining the base rate. Every layer compounds.
Dimensional Weight: Why Light Parcels Cost More Than the Scale Says
Every major Canadian carrier compares actual weight with dimensional (cubic) weight and charges on whichever is higher. UPS Canada uses a divisor of 139 cubic inches per pound (or 5,000 cubic centimetres per kilogram) for most domestic shipments. FedEx uses the same 139/5,000 divisor for intra-Canada packages. Purolator applies 12.4 lb per cubic foot for Ground shipments and 15 lb per cubic foot for Express. Canpar matches those figures: 12.4 lb/ft³ for Ground, 15 lb/ft³ for Select.
For merchants shipping products that are lightweight but packaged in standard boxes (supplements, tea, apparel, consumer electronics accessories), dimensional weight routinely doubles or triples the billable weight on the invoice. That inflated weight flows through to every surcharge calculated as a percentage of the base rate, including fuel.
Residential Surcharges: The Hidden Per-Parcel Adder
DTC means delivering to homes. Every major private carrier in Canada charges a residential delivery surcharge on top of the transportation rate:
- UPS Canada’s 2026 rate guide lists a residential delivery surcharge of $5.05 per delivery.
- FedEx Ground’s 2026 guide lists $4.80 per package.
- Canpar’s 2025 Service Guide lists $4.65 per shipment.
For merchants whose order mix is 80% or more residential (common in DTC), this surcharge is effectively a permanent per-parcel cost that many never factor in when evaluating their carrier rate card.
Fuel Surcharges: Compounding, Not Flat
Fuel surcharges are not a static dollar amount added to each label. They are index-based, adjusted weekly (or monthly for Purolator), and applied as a percentage of the net rate plus applicable surcharges:
- UPS Canada adjusts weekly every Monday based on the Natural Resources Canada diesel index, as detailed on UPS’s fuel surcharge page.
- FedEx adjusts weekly on the same diesel index.
- Purolator adjusts monthly, effective the first Monday of each month.
- Canpar adjusts weekly.
Fuel surcharges compound on top of the base rate, the residential surcharge, and other transportation-related charges. FedEx Ground’s 2026 rate documentation confirms the fuel surcharge is assessed on the net package rate plus applicable transportation-related surcharges and pickup fees. When the fuel index moves, it amplifies every other cost layer beneath it. Two merchants with identical base rates can pay meaningfully different all-in costs depending on when their parcels ship during a fuel-price cycle.
How Geography Changes the Bill: Inter-Province vs. Intra-Province
| Lane Type | Merchant Paid (Median) | PnP-Managed Rate (Median) | Gap (%) | n (Parcels) | M (Merchants) |
| Intra-province | $13.62 | $9.28 | 31.9% | 12,294 | 11 |
| Inter-province | $28.02 | $12.80 | 54.3% | 9,360 | 11 |
Ontario-Origin Lanes
Ontario is the highest-volume origin province in this cohort. The per-lane breakdown shows how the gap varies by destination.
| Lane (Origin → Destination) | n (Parcels) | M (Merchants) | Gap (%) |
| ON → NB | 73 | 3 | 52.3% |
| ON → QC | 329 | 5 | 41.0% |
| ON → BC | 49 | 6 | 39.0% |
| ON → PE | 18 | 3 | 37.1% |
| ON → SK | 101 | 4 | 33.3% |
| ON → AB | 34 | 4 | 28.8% |
Geography introduces zone-based pricing, extended-area surcharges, and carrier network density differences. A parcel moving from Toronto to Vancouver crosses more zones than one from Toronto to Ottawa, but the rate gap is not simply a function of distance. Carrier network strength varies by corridor. Some carriers are strong coast-to-coast. Others concentrate within a specific region. The managed rate reflects routing to the carrier with the best economics on each corridor, not defaulting to one carrier for everything.
Multi-Piece Shipments: The Most Expensive Configuration Error in the Cohort
The single largest gap in this dataset: 57.7% on multi-piece shipments.
Multi-piece shipments are orders that contain more than one package going to the same address. When these are dispatched as individual labels rather than grouped under one shipment record, each parcel incurs its own residential surcharge, its own minimum charge, and its own fuel calculation. Grouping them correctly means the carrier applies a single residential surcharge and calculates fuel on the consolidated shipment.
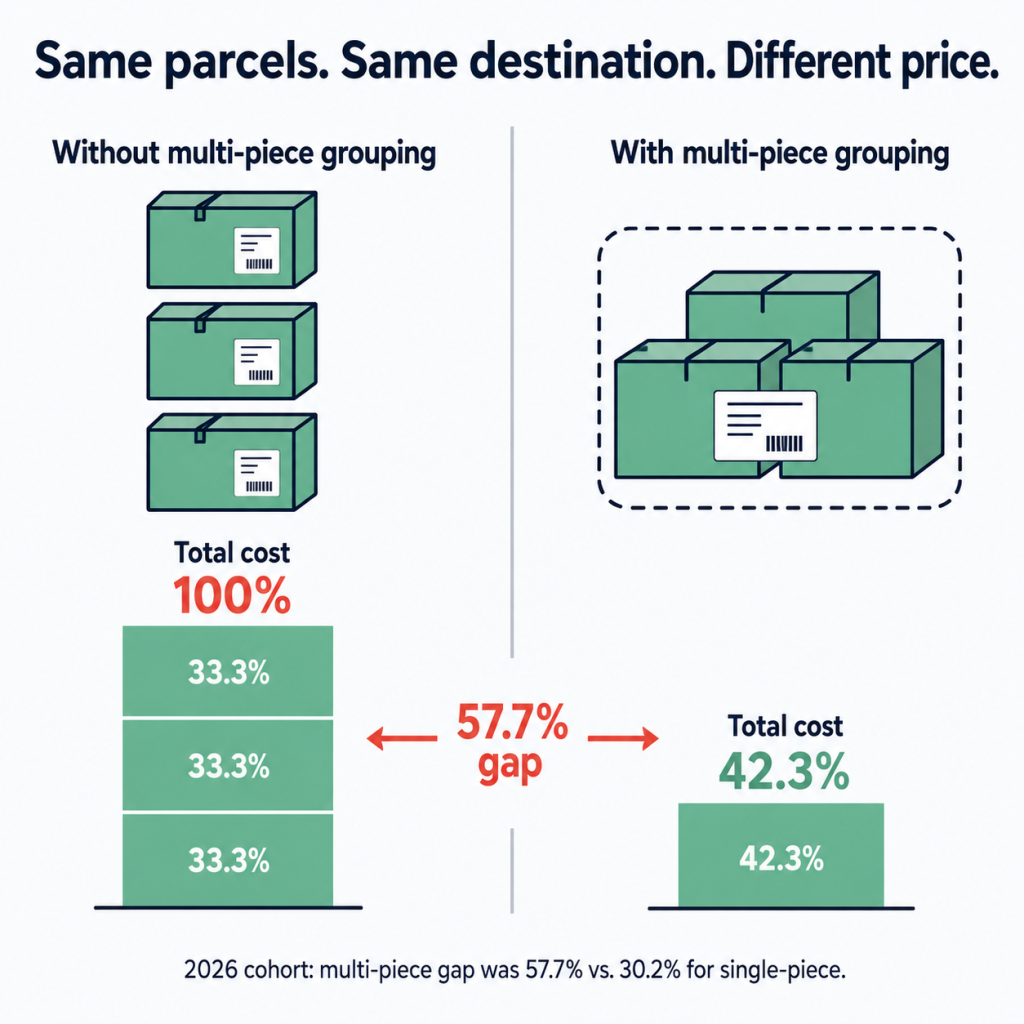
This is a configuration and routing problem, not a carrier problem. Dispatch tools (ShipStation, Shopify Shipping, and similar platforms) do not automatically group multi-package orders into multi-piece shipments unless they are explicitly configured to do so. Most merchant setups ship each package as an independent label, and the merchant never sees the difference on any individual invoice line. The cost shows up only in aggregate, over thousands of shipments, when someone actually runs the comparison.
The counter-argument we hear frequently is that the dispatch platform should handle this. Our position: you can’t get good outputs from bad inputs. The platform does what it’s told. If the routing rules are not configured to group multi-piece orders, the platform will dutifully generate individual labels and the merchant will dutifully overpay on every one. Managed configuration is the fix, not a different platform.
Carrier Mix in the Cohort
| Carrier (used before PnP) | Parcels | Share of Cohort Parcels |
| Purolator | 17,731 | 79.3% |
| Canpar | 1,795 | 8.0% |
| UPS | 1,491 | 6.7% |
| Canada Post | 949 | 4.2% |
| FedEx | 302 | 1.4% |
| DHL | 79 | 0.4% |
Purolator’s dominance here reflects the carrier mix of these 11 merchants, not a recommendation. Different merchants, different products, and different corridors produce different optimal mixes. The benchmark compares each merchant’s paid rate to the best available PnP-managed rate for that specific parcel, regardless of which carrier delivers it.
A single-carrier strategy consistently underperforms a managed multi-carrier approach at this volume level. No one carrier is cheapest on every lane, every weight band, and every service tier. The merchants in this cohort who showed the narrowest gaps were already running multi-carrier setups with active rate monitoring. The ones with the widest gaps were overwhelmingly single-carrier or had not renegotiated since their initial setup. Our case studies document this pattern repeatedly: a coffee company cut 30% through multi-carrier strategy, and an apparel brand saved 34% by adding regional carriers to their mix.
Two Real Parcels, Side by Side
Numbers in aggregate tell one story. Individual parcels tell another. Here are two real shipments from the cohort.
Parcel 1: Lightweight standard, coast-to-coast
- Weight: 1 lb
- Origin: Vancouver, BC
- Destination: Toronto, ON
- Merchant paid: $17.39 (UPS Standard)
- PnP-managed rate: $11.44 (Purolator Ground)
- Gap: 34%
Parcel 2: Mid-weight, postal code to postal code
- Weight: 3.7 lb
- Origin: V6H 3K1 (Vancouver)
- Destination: M4L 3K6 (Toronto)
- Merchant paid: $25.50 (Canada Post Expedited)
- PnP-managed rate: $20.60 (Purolator Ground)
- Gap: 19.2%
Neither merchant was on a bad carrier. Both were using established Canadian carriers with negotiated rates. The gap is about which rate card the merchant has access to on that carrier, and whether anyone is actively managing the routing to place each parcel on the most cost-effective option. That is the difference between an unmanaged carrier account and a managed one.
Book an Invoice Review
If you ship 50+ orders per day, we will compare your last 30 days of carrier invoices against this benchmark, parcel by parcel, and show you exactly where the leakage is: by lane, by weight band, by carrier, by surcharge. No platform switch required. No cost. About 10 business days.
What This Benchmark Does Not Cover
Service quality and transit time. This analysis measures cost, not delivery performance. A cheaper rate with an unreliable carrier is not a better rate. Transit time commitments, tracking reliability, and carrier claims processes all matter. None of them are measured here.
Cross-border shipments. Every parcel in this cohort is domestic Canadian. Cross-border shipping economics involve duties, brokerage fees, customs documentation, and an entirely different cost structure. We plan to publish a cross-border benchmark later in 2026.
Canada Post retail counter rates. This cohort reflects merchant shipping accounts, not retail walk-in rates. Canada Post retail pricing is a different rate structure serving a different use case.
Package-level profit. The benchmark shows the shipping cost gap. It does not calculate net margin per order after product cost, marketing spend, and other variable expenses. A 30% shipping cost reduction matters differently depending on your product margin.
Methodology
What we measured
Each parcel in the dataset has two rates: the rate the merchant actually paid on their carrier invoice, and the rate that same parcel (same weight, same dimensions, same origin, same destination, same ship date) would have cost through Part n Parcel’s managed carrier program. The PnP rate is the standard program rate available to any merchant in the network, not PnP’s internal cost and not a preferential tier.
The cohort
22,353 domestic Canadian parcels. 11 merchants. Ship dates from January through May 2026. All merchants were active shippers at the time of analysis. The cohort skews toward Ontario-origin shipments and toward Purolator as a carrier, reflecting the merchants who participated. It is not a random sample of all Canadian DTC shipping.
Why 2026 ship dates only
Carrier rate structures reset annually. FedEx Canada’s standard list rates increased effective January 5, 2026, with a publicly stated average increase of 5.9%. Purolator publicly reset LTL freight rates on January 1, 2026. UPS Canada and Canpar both have current 2026 rate and surcharge documentation in effect. Mixing 2025 and 2026 invoices would blur the comparison across two different rate environments.
What the PnP rate reflects
Every PnP rate in this benchmark is the rate a merchant enrolled in Part n Parcel’s program would pay for that parcel through our managed carrier setup. It includes the carrier’s rate to PnP’s network plus PnP’s transparent markup. It is not a hypothetical best-case scenario. It is the actual rate structure our merchants ship on.
Statistical thresholds
We report cuts only when at least 3 merchants (M ≥ 3) contribute data. This prevents any single merchant’s volume from driving a reported statistic and protects merchant anonymity. The disclosure of both n (parcels) and M (merchants) on every cut is intentional. A large n with a small M tells a different story than a large n with a large M.
How this differs from existing public data
Statistics Canada’s Couriers and Messengers Services Price Index gathers courier price data from company websites, not from negotiated merchant invoices. Canada Post’s e-commerce research draws on retailer surveys and shopper panels (755 retailers and 5,000 shoppers in recent waves), which is useful context but still different from invoice-level price observation. Carrier rate guides (FedEx, UPS, Purolator, Canpar) publish list rates and service definitions, not negotiated account outcomes. No comparable public Canadian benchmark matching parcel-level, actual-paid DTC domestic invoice data benchmarked to a same-parcel alternative quote was found in our review of official and neutral sources.
Annual update
This benchmark will be re-cut each January as GRI resets take effect. Every merchant who joins the network sharpens the dataset for the next edition. Edition 1 covers January through May 2026.
Frequently Asked Questions
How much does it cost to ship a parcel in Canada in 2026?
It depends on the carrier, the weight, the origin, the destination, and the rate card the merchant has access to. In this cohort of 22,353 domestic Canadian parcels, the median merchant-paid rate was $15.84 per parcel. The median PnP-managed rate on those same parcels was $11.03. List rates published in carrier guides are higher still, because they reflect the posted price before any account-level negotiation.
What is a good shipping cost per order for Canadian e-commerce?
There is no universal answer, because shipping cost per order varies by weight, dimensions, corridor, carrier, and account structure. What this benchmark shows is the gap: the median merchant in our cohort was paying 30.7% more than the PnP-managed rate on the same parcels. If your per-order cost significantly exceeds the PnP-managed medians published in this report for your weight band and lane, your account likely has room to tighten. The only way to know what you’re overpaying is to run a shipping cost analysis against the managed benchmarks the gap it surfaces is money leaving your margin on every parcel.
Are these list rates or negotiated rates?
Neither side of this comparison uses list rates. The merchant-paid column reflects what each merchant actually paid on their carrier invoice after whatever negotiation they had in place. The PnP-managed column reflects the rate that parcel would have cost through our program, which includes enterprise-level carrier rates accessed through collective volume plus PnP’s transparent markup. List rates were excluded from the analysis entirely. That is a deliberate methodological choice: list rates are what carriers publish, not what anyone pays, and including them would inflate the reported gap beyond what a merchant would actually experience.
Does switching carriers mean losing my current rates?
Not necessarily. Part n Parcel sets up direct carrier accounts for each merchant. The rates are tied to PnP’s network agreement and collective volume. If a merchant already has carrier relationships they want to keep for specific routes or service levels, those can run alongside the managed accounts. The benchmark comparison in this report evaluates whether the merchant’s current account is competitive on each parcel, regardless of the carrier.
What about Canada Post? Why is it not more prominent in the data?
Canada Post appears in the cohort (see Parcel 2 in the examples above), but Purolator, FedEx, UPS, and Canpar carry the majority of this cohort’s volume. That reflects the carrier choices these 11 merchants had in place. Canada Post’s 2024 labour disruption, where operations halted from November 15 through December 17, is still cited by merchants as a factor in their carrier diversification decisions. This benchmark does not evaluate Canada Post’s service or rates in isolation.
Can I see how my invoices compare to this benchmark?
Yes. We offer a complimentary invoice review for merchants shipping 50 or more orders per day. We compare your last 30 days of invoices against the benchmark and show where you are overpaying by lane, weight, carrier, and surcharge. No platform switch required. The process takes about 10 business days. Book an invoice review here.
About Part n Parcel
Part n Parcel is a managed shipping economics company for Canadian e-commerce merchants. We give each merchant their own direct carrier accounts at enterprise rates, accessed through collective volume and a decade of carrier relationships across FedEx, UPS, Canpar, Purolator, and regional networks. We configure the shipping platform, optimize the routing, monitor the account, and manage it all ongoing for a transparent markup.
We are not a rate aggregator, a fulfillment platform, or a 3PL. We do not resell labels under a master account. The merchant’s account is in their name, with full rate transparency and direct carrier support. Our case studies document results across apparel, food production, health and wellness, and other Canadian DTC verticals, with savings ranging from 15% to 57%.
The Gap Between What You Pay and What You Should Pay
Every invoice you do not audit is money leaving your business. This benchmark exists so you can measure yours.
If you ship 50+ orders per day, we will compare your last 30 days of carrier invoices against these numbers, parcel by parcel, and show you exactly where the leakage is: by lane, by weight band, by carrier, by surcharge. No platform switch required. No cost. About 10 business days.
Or, if you want a quick estimate before committing to the full review: Run the Shipping Savings Estimator
Sources Cited
- Part n Parcel managed program rates, 2026
- Part n Parcel merchant audit data, January to May 2026 (11 merchants, 22,353 domestic Canadian parcels)
- Part n Parcel case studies
- UPS Canada Rate and Service Guide 2026 (service definitions and surcharge schedules)
- FedEx Express and FedEx Ground Rate Guides 2026, Canadian Edition (service definitions; effective January 5, 2026)
- Purolator Rate, Zone and Service Guides (service definitions and surcharge schedules; postal-code specific)
- Canpar Ancillary and Miscellaneous Rates (2023 edition, the most recent public document; no consolidated 2026 guide published by Canpar at time of report)
- FedEx Canada, Shipping and Courier Rate Changes: 2026 Updates
- UPS Canada, Fuel Surcharge
- UPS Canada, Package Dimensions, Size Limits and Weight Guide
- Statistics Canada, Technical Guide for the Couriers and Messengers Services Price Index, published 2023
- Canada Post, strike notice and restart announcements, November to December 2024
- Government of Canada, Report of the Industrial Inquiry Commission: Canada Post, 2025
- List rates from the above guides were not used as comparison points in the benchmark; see methodology section for rationale