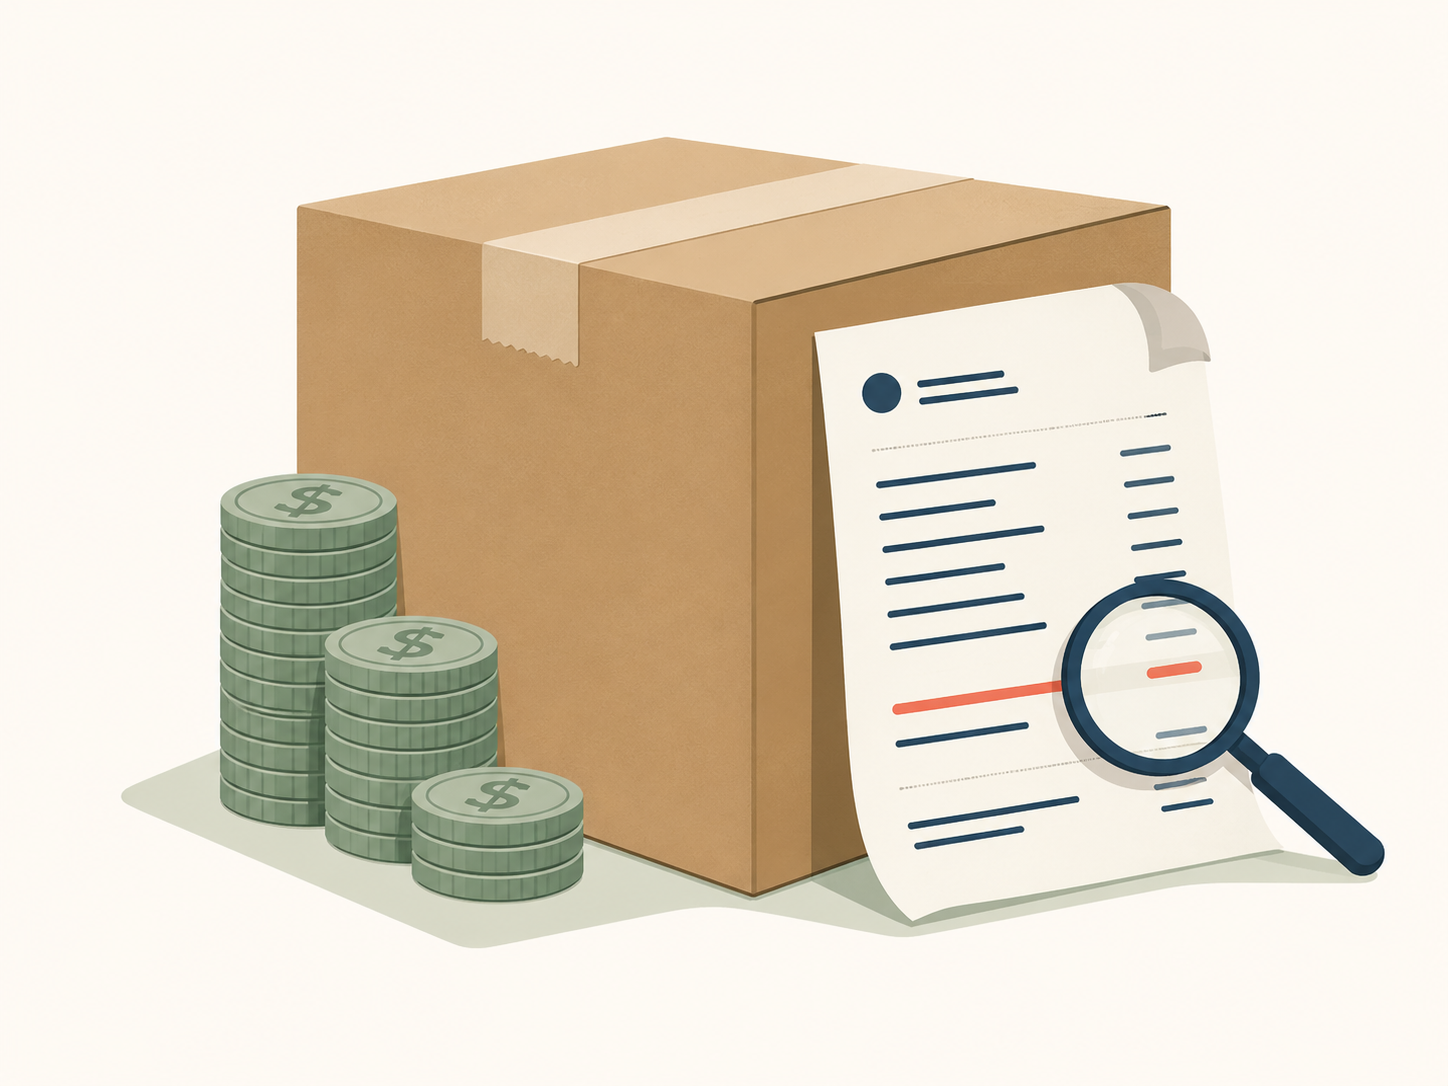
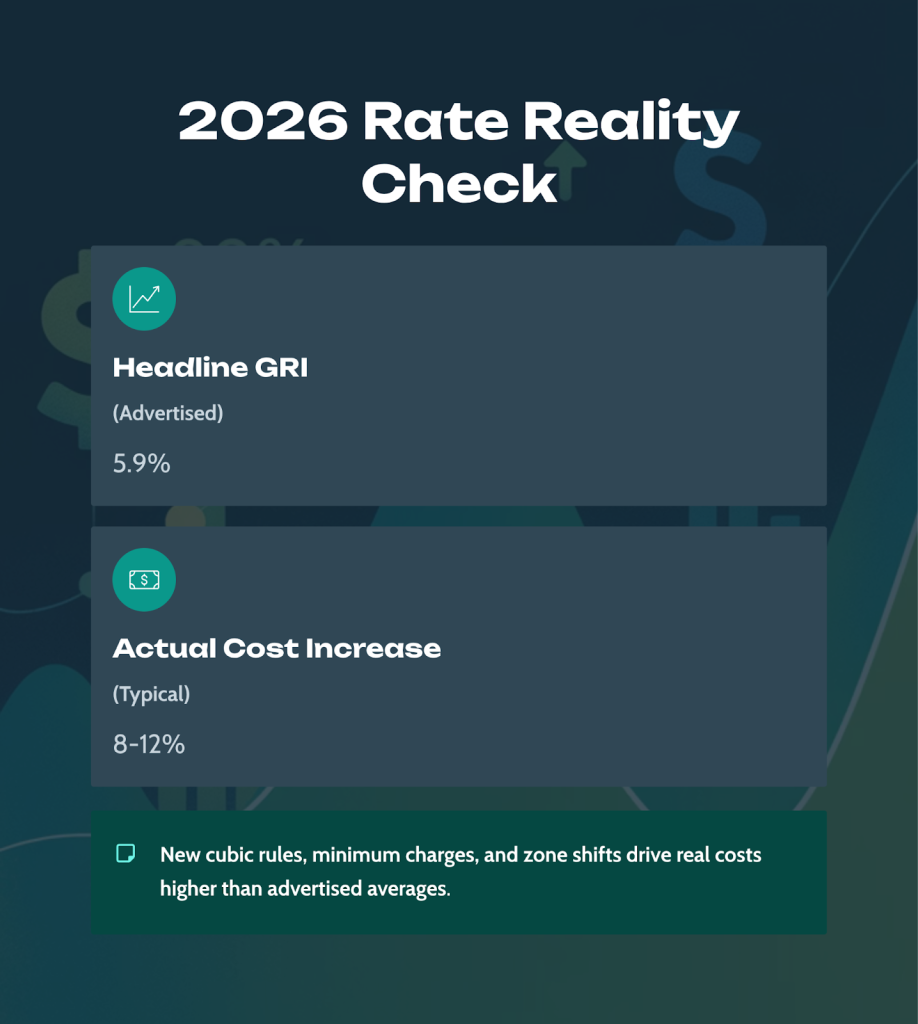
Benchmarking carrier rates in 2026 requires analyzing far more than the advertised general rate increases (GRI). At Part n Parcel, we’ve helped 240+ Canadian businesses in our closed network navigate carrier pricing. The headline GRI figures tell only a fraction of the story. The real cost impact comes from surcharge restructuring, zone realignments, minimum charge increases, and how the GRI impacts each zone and weight differently that can push your actual shipping costs 8-12% higher than the published 5.9% average.
This guide walks through the complete benchmarking methodology Canadian businesses need to accurately compare FedEx, UPS, Canada Post, Purolator, Canpar, and local carriers like FleetOptics, and Ecom Logistic for the 2026 fiscal year.
Why 2026 Carrier Benchmarking Requires a New Approach
The 2026 rate cycle introduces structural pricing changes that make traditional benchmarking methods obsolete. Carriers have shifted from simple volume-based pricing to sophisticated yield management systems that price every package based on profitability metrics.
FedEx implemented a 5.9% general rate increase for 2026, and UPS announced a similar 5.4% average increase, continuing a pattern of consistent annual hikes. However, this percentage represents a weighted average across all service levels and zones. Your actual increase depends on your specific shipping profile.
The three biggest changes for 2026:
- Cubic volume triggers for surcharges – Both FedEx and UPS apply Additional Handling fees based on total cubic inches, not just linear dimensions. This targets low-density shipments like apparel, bedding, and lightweight products in large boxes.
- Minimum charge – FedEx minimum charge increases annually, effectively eliminating discounts for lightweight packages. If your negotiated rate calculates to $8.00 for a 1 lb package, you’ll still pay for example the $11.99 minimum charge.
- Zone realignments – UPS updated its postal code-to-zone mappings, shifting thousands of destinations to higher-cost zones without changing the rate card. A shipment that was Zone 5 in 2025 might be Zone 6 in 2026, increasing costs even if Zone 5 rates stayed flat.
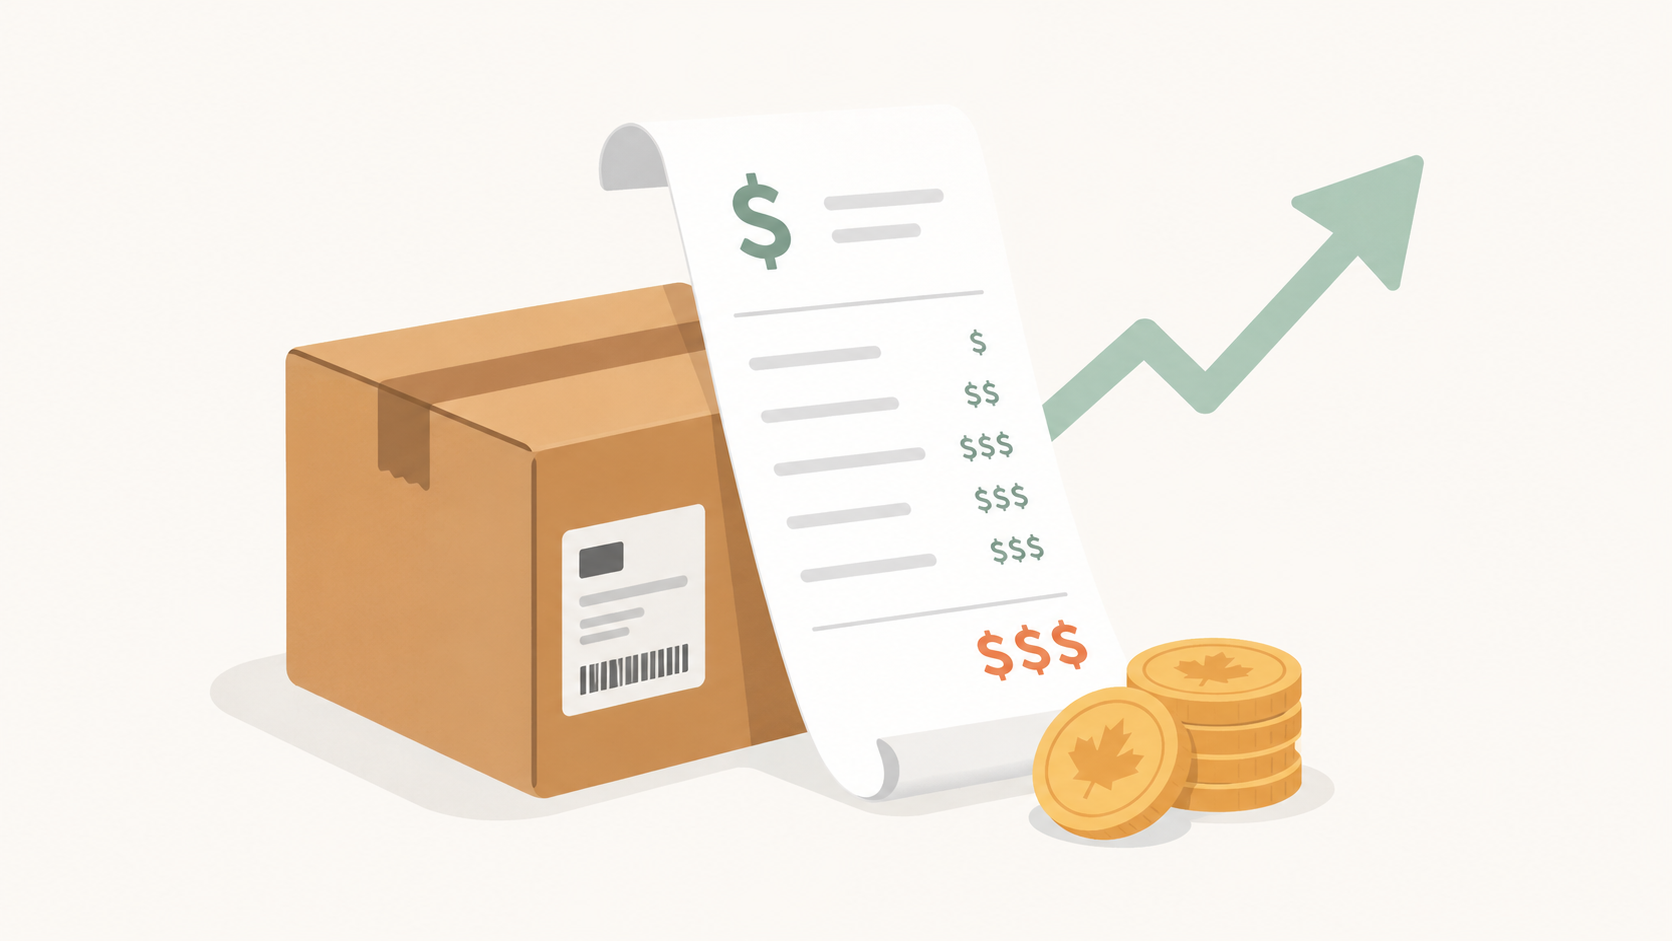
These changes mean you cannot simply apply a 5.9% factor to your 2025 shipping spend to forecast 2026 costs. Through our closed network, we’ve seen companies with identical shipping volumes face cost increases ranging from 4% to 14%. The variation depends entirely on their package profiles.
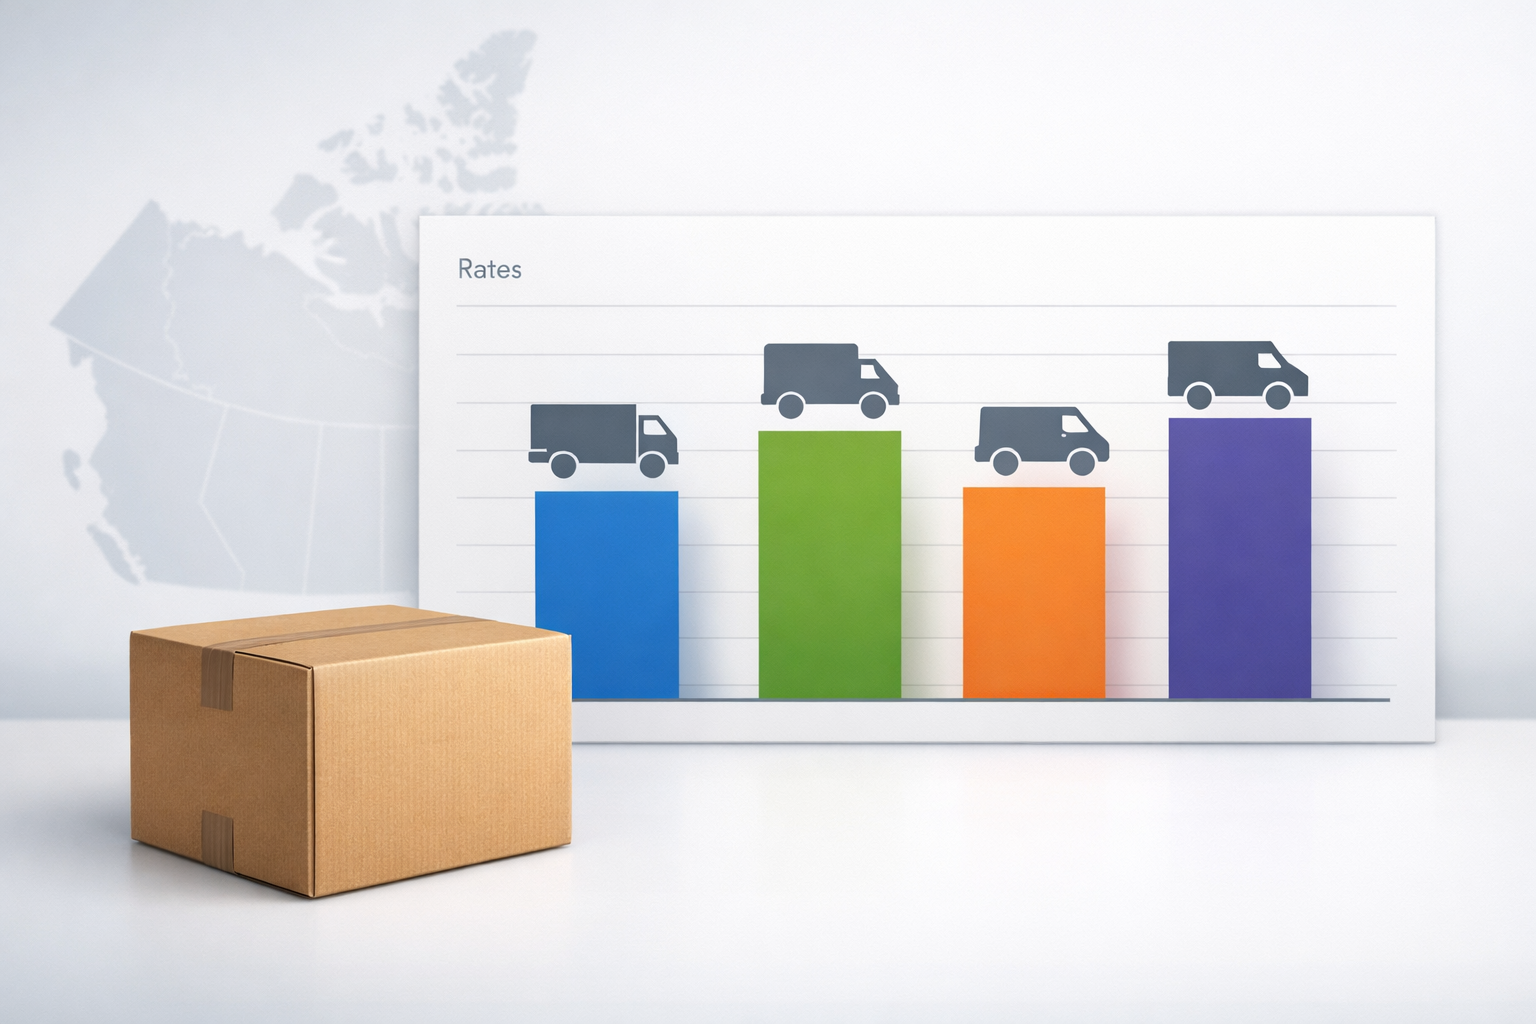
Understanding the 2026 Rate Landscape
Before benchmarking carriers against each other, you need to understand each carrier’s 2026 strategy and timing. The effective dates alone create planning complexity.
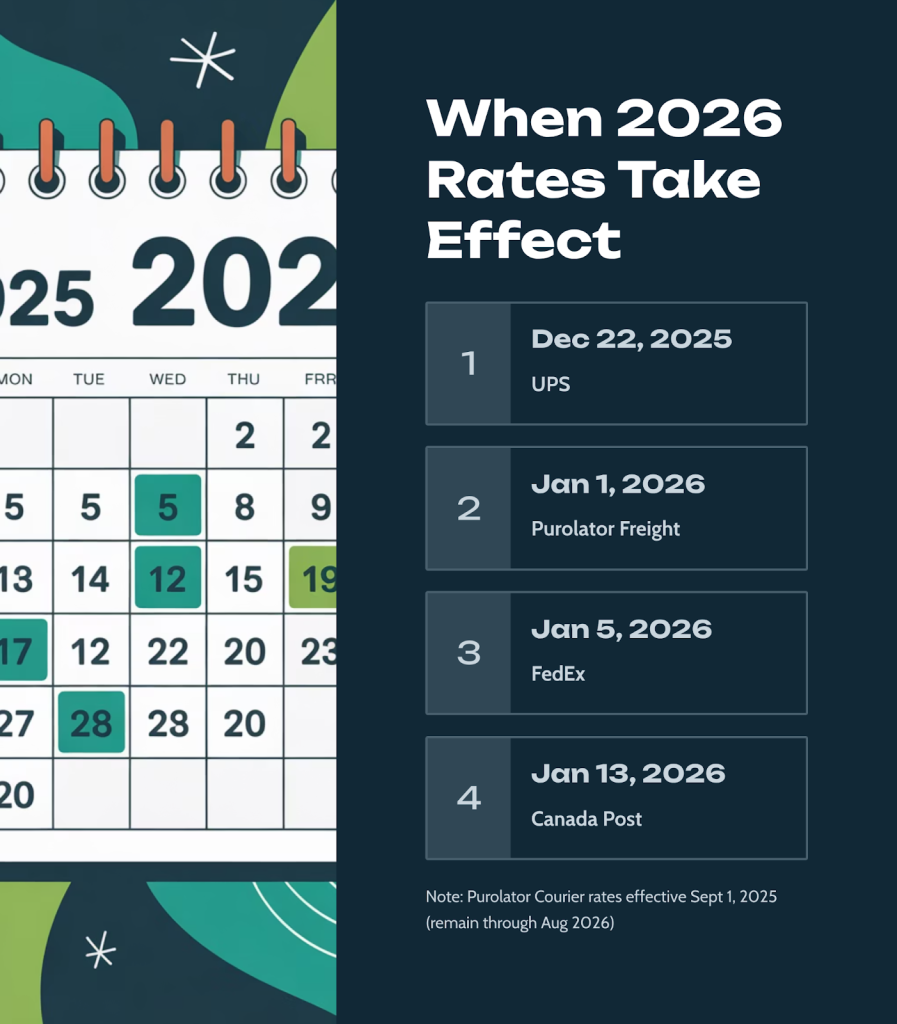
| Carrier | Effective Date | Key Focus | Implementation Strategy |
| FedEx | January 5, 2026 | Cubic volume rules | Targets low-density freight |
| UPS | December 21, 2025 | Zone realignments | Pre-holiday implementation |
| Canada Post | January 13, 2025 | 128-code structure | Urban/rural pricing split |
| Purolator | September 1 (courier), January 1 (freight) | Dual timeline | Split service approach |
These are the standard GRI effective dates carriers announce publicly. However, businesses with custom commercial agreements can negotiate different effective dates. This timing flexibility is particularly valuable for avoiding rate increases during peak shipping periods. At Part n Parcel, our direct carrier relationships allow members to secure GRI dates that protect margins during Q4 and other high-volume periods.
FedEx Canada’s 2026 Changes
FedEx implemented its changes on January 5, 2026. The 5.9% average increase masks significant variation by service level and zone.
Key changes:
- Ground minimum charge: $11.99 (up from $11.32)
- Residential surcharge: 3.2% increase
- New cubic volume threshold for Additional Handling: 10,368 cubic inches
- Delivery Area Surcharges expanded to more rural postal codes
FedEx’s dimensional weight divisor remains 139 for most services, but the new cubic rules mean packages can trigger surcharges even if they pass traditional length/width/height tests.
UPS Canada’s 2026 Updates
UPS rates became effective December 21, 2025 – before the calendar year. This pre-holiday implementation captures the post-holiday returns period and early-year restocking at 2026 rates.
UPS announced a 5.4% average increase, implemented through:
- Postal code-to-zone chart realignments affecting Canadian destinations
- Increases to Large Package Surcharges, particularly for remote zones
- Additional Handling surcharges based on cubic volume thresholds
- Various administrative and service-specific fee increases
Canada Post’s New 128-Code Structure
Canada Post expanded its commercial parcel rate structure from 45 codes to 128 codes, enabling extreme pricing granularity. The weighted average increase is under 1%, but this heavily favors urban volume.
How this affects benchmarking:
- Urban routes (Toronto, Vancouver, Montreal) may see rate decreases
- Rural and remote routes face increases well above 1%
- The 128-code system makes carrier-to-carrier comparison more complex
- Canada Post now has regulatory authority to adjust rates mid-year
For businesses with mixed urban/rural shipping, you must re-rate your entire history against the new code structure. The “under 1%” claim doesn’t apply to all shipping profiles. Canada Post is likely to make further changes in early 2026.
Purolator’s Dual Timeline
Purolator operates on two separate rate cycles that complicate annual budgeting.
Courier (parcel) rates adjusted September 1, 2025 with approximately 5.7% increase. These rates remain in effect through August 2026.
Freight (LTL) rates updated January 1, 2026. This split means you need two benchmark calendars for a single carrier.
Purolator introduced several surcharges worth noting:
- Manual Bill of Lading fee: $4.25 per shipment (pushes shippers to digital platforms)
- Dangerous Goods Non-compliant: $75 per piece
- Peak surcharges extend through mid-January 2026
Canpar Express: The B2B Value Alternative
Canpar Express is a national carrier positioning as the value-focused B2B alternative to the premium integrators. While specific 2026 GRI details release later in the cycle, Canpar generally tracks market trends with a base rate advantage. The 2025 GRI took place in October.
For the 2025-2026 peak season, Canpar waived many peak surcharges that competitors charged, making them attractive for bulky or heavy items during Q4. This competitive pricing strategy, combined with national coverage, makes Canpar a critical benchmarking option for businesses shipping commercial freight.
Regional and Specialized Carriers
Local carriers provide critical benchmarking alternatives, especially for specific shipping profiles.
GLS Canada is a regional carrier focusing on the Quebec-Ontario corridor. Their January 1, 2026 rates target businesses with concentrated Eastern Canada volume. For intra-QC/ON shipments, GLS often beats national carrier rates by 10-15%.
FleetOptics is a local carrier serving high-density urban areas only (Toronto, Vancouver, Montreal) with 99% delivery performance. Because they don’t service expensive rural routes, they avoid the cross-subsidization built into national carrier rates. For urban-only volume, FleetOptics typically offers 15-25% savings versus FedEx/UPS residential rates.
Ecom Logistic and similar cross-border specialists are becoming increasingly important as cross-border e-commerce continues to grow. They help Canadian businesses avoid per-package international processing fees by consolidating shipments.
Key Surcharge Comparison
| Surcharge Type | FedEx Canada | UPS Canada | Impact |
| Residential | 3.2% increase | Significant increase | B2C e-commerce cost driver |
| Additional Handling | Cubic volume-based | Cubic volume-based | Targets low-density items |
| Minimum Charge | $11.99 | Market-aligned increase | Eliminates lightweight discounts |
| Remote Area | Expanded zones | Zone realignment | Rural delivery penalty |
Step-by-Step Benchmarking Methodology
Accurate benchmarking requires systematic analysis of your complete shipping profile. Here’s the methodology we use when analyzing carrier performance for Canadian businesses.
Step 1: Collect and Clean Your Data
Export 12 months of shipping history from your current carrier(s). You need:
- Package weight (actual and billed if different)
- Dimensions (length, width, height)
- Origin and destination postal codes
- Number of Parcels
- Service level used
- Base rate charged
- All surcharges (itemized)
- Total cost per shipment
Clean the data by removing:
- One-off shipments (like trade show equipment)
- Returns and reverse logistics (benchmark separately)
- Incomplete records missing weight or dimensions
Segment your data into profiles:
| Profile Type | Definition | Why It Matters |
| Zone Distribution | Percentage of volume by carrier zone (1-8) | Higher zones cost disproportionately more |
| Weight Bands | Volume breakdown (<5 lbs, 5-20 lbs, 20-50 lbs, 50+ lbs) | Minimum charges affect light shipments differently |
| Dimensional Profile | Calculate volume for each package (L×W×H) | Identifies exposure to new cubic rules |
| Delivery Type | Residential vs commercial percentage | Residential surcharges are your highest cost-per-package |
| Service Urgency | Express vs ground split | Ground offers most optimization opportunity |
This segmentation reveals where your costs concentrate. Through our closed network, we’ve seen companies realize that 80% of their costs come from 20% of their routes. This makes targeted optimization possible.
Step 2: Calculate Your True Costs (Include All Surcharges)
Base rates are meaningless without accounting for surcharges.
For 2026, you must model these specific fees:
Dimensional Weight Impact Calculate the dimensional weight for every package:
- Dimensional Weight = (Length × Width × Height) ÷ Divisor
- FedEx/UPS divisor: 139
- Compare dimensional weight to actual weight
- You’re charged on whichever is higher
Flag packages where dimensional weight exceeds actual weight by 50% or more. These are your highest-risk items for the new cubic surcharge rules.
Cubic Volume Surcharges Both FedEx and UPS now trigger Additional Handling fees based on total cubic volume:
- Threshold: 10,368 cubic inches
- Fee: $20-30 depending on service
- Applies even if linear dimensions pass individual tests
Calculate: Length × Width × Height for each package. Any package exceeding 10,368 cubic inches will incur this surcharge starting January 12, 2026.
Minimum Charge Floor For every package, compare your discounted rate to $11.99:
- If calculated rate < $11.99, you pay $11.99
- This creates a “discount dead zone” for lightweight items
Example: You have a 50% discount off a $16.00 base rate for a 1 lb package. Your calculated rate is $8.00, but you’ll actually pay $11.99.
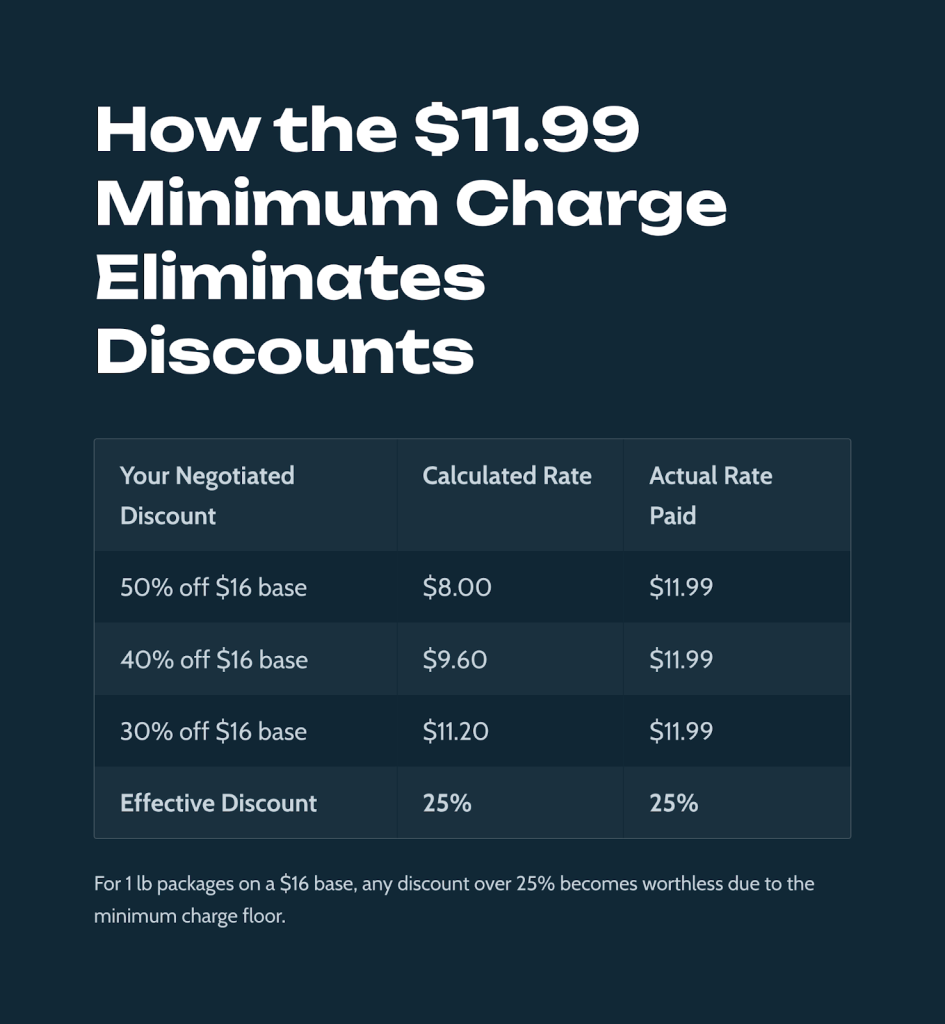
Your “effective discount” is only 25%, not 50%.
Residential Delivery Surcharge Apply the 3.2% increase to all residential surcharges. For FedEx, this means:
- 2025: ~$4.65 per residential package
- 2026: ~$4.80 per residential package
If you ship 10,000 residential packages annually, this single surcharge increase costs $1,500 more per year before any base rate changes.
Delivery Area Surcharges (DAS) Remote and rural postal codes face steep surcharges:
- Extended residential: $4.08 per pound or $120.80 per package (whichever is greater)
- Commercial extended: Lower but still significant
Review your destination postal codes against carrier DAS zone maps. Carriers frequently expand these zones without announcing rate card changes.
Step 3: Test Zone Realignments
UPS’s December 2025 zone chart update affects thousands of routes. You must re-rate your historical shipments against the new zones.
Process:
- Export your top 500 destination postal codes by volume
- Look up each postal code in the 2025 UPS Zone Chart
- Look up the same postal codes in the 2026 UPS Zone Chart
- Flag any changes (e.g., postal code M4S shifts from Zone 2 to Zone 3)
- Calculate the cost delta purely from zone reclassification
Example scenario:
- Toronto to rural Alberta route
- 1,000 packages annually at 10 lbs average
- Shifts from Zone 5 to Zone 6
- Zone 5 rate: $18.50 per package
- Zone 6 rate: $21.75 per package
- Annual impact: $3,250 from zone shift alone (before GRI)
This “stealth hike” compounds with the 5.9% GRI, creating total increases of 15-20% on specific lanes.
Step 4: Model Multiple Scenarios
Test your shipping costs under three different carrier strategies:
Scenario 1: Status Quo Apply all 2026 rate changes to your current carrier mix. This is your baseline.
Scenario 2: Strategic Carrier Mix Route volume to the optimal carrier by package profile:
- Urban residential → FleetOptics
- Rural residential → Canada Post
- B2B commercial → Canpar
- Time-definite express → FedEx/UPS
Calculate: (Urban Volume × FleetOptics Rate) + (Rural Volume × Canada Post Rate) + (B2B Volume × Canpar Rate) + (Express Volume × FedEx/UPS Rate)
Watch for volume tier thresholds. If moving urban volume away from your primary carrier drops you to a lower discount tier, that penalty must be factored in.
Scenario 3: Negotiated Improvements Model what your costs would be with improved terms from your current carrier:
- 5% additional base rate discount
- Residential surcharge discount (25% off)
- Improved dimensional weight divisor (from 139 to 166)
At Part n Parcel, we leverage collective volume from our closed network of 240+ Canadian members to access enterprise rates. Individual companies typically can’t negotiate these rates alone. This approach often delivers savings comparable to Scenario 2 without the complexity of managing multiple carriers.
Step 5: Factor in Service Requirements
Cost isn’t the only benchmarking metric. Service requirements affect your real-world carrier choice.
Transit Time Analysis Map your destination postal codes to each carrier’s published transit times:
- How many destinations can each carrier deliver within 2 business days?
- Which carrier offers the most reliable service to your key markets?
- Do any carriers have transit time blind spots in your network?
Through our closed network, we’ve found that shorter transit times often justify 5-10% higher rates. They reduce customer service inquiries and improve repeat purchase rates.
Service Reliability Metrics Request from each carrier (or extract from your own data):
- On-time delivery percentage
- Claims rate per 1,000 packages
- Average claim resolution time
- Package scan frequency
For high-value goods or products where customer experience is paramount, the cheapest carrier may not be the best carrier.
Integration Requirements Consider technical complexity:
- Does your e-commerce platform integrate natively with each carrier?
- What are the API costs or platform fees?
- Will you need a transportation management system (TMS) to manage multiple carriers?
FleetOptics integrates seamlessly with ShipStation, which we use for nearly all client implementations. This reduces technical friction compared to some local carriers that require custom integrations.
Common Benchmarking Mistakes to Avoid
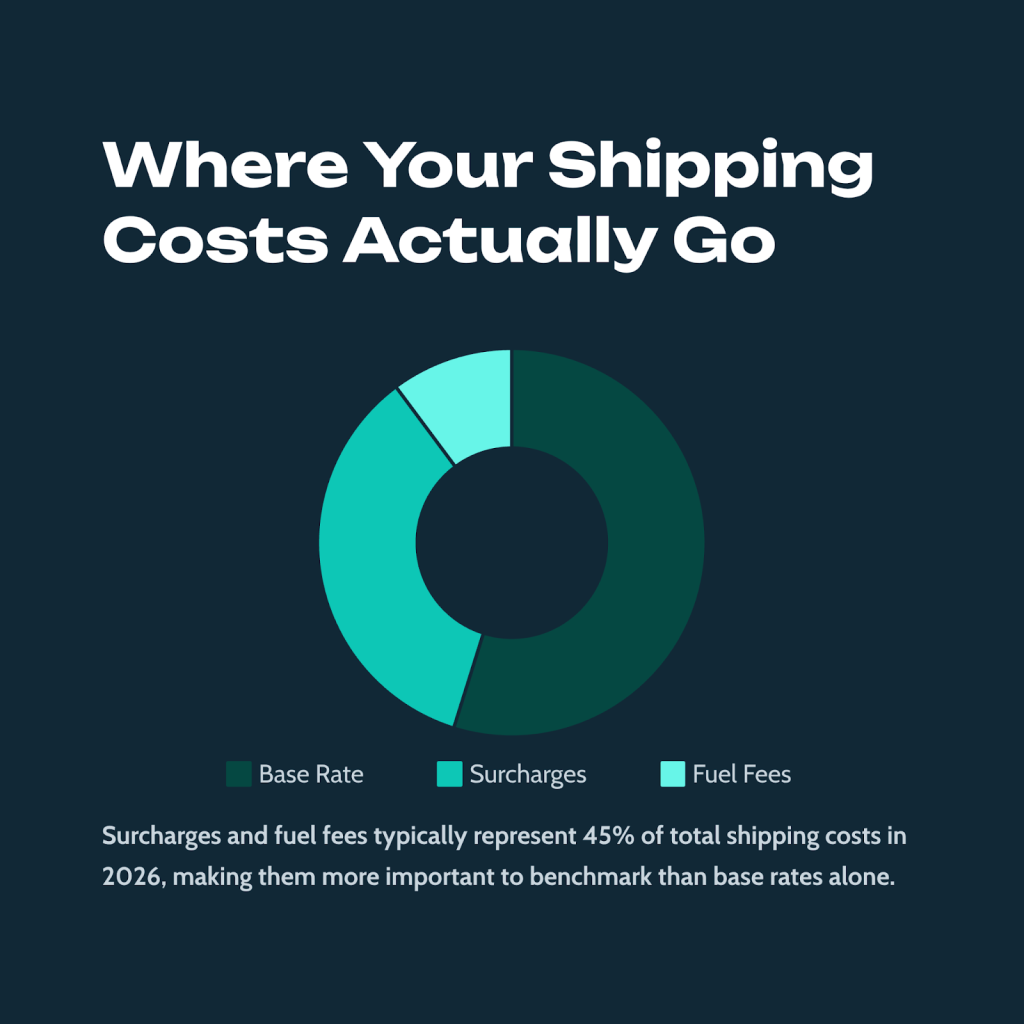
Mistake 1: Comparing Only Base Rates The base rate is typically 50-70% of your total cost. Surcharges, fuel fees, and minimum charges make up the rest. A carrier with a 10% lower base rate but higher surcharges will cost more overall.
Mistake 2: Ignoring Effective Dates Carriers implement changes on different dates:
- UPS: December 22, 2025
- FedEx: January 5, 2026
- Canada Post: January 13, 2025 (lettermail), variable for parcels
- Purolator: September 1 (courier), January 1 (freight)
Budget planning must account for these misalignments. If you’re budgeting for a fiscal year starting April 1, 2026, you’ll be operating under different rate cards than companies on a calendar year.
Mistake 3: Using Averages for Non-Average Profiles Canada Post’s “under 1% average increase” is heavily weighted by urban volume. If your shipping profile is 60% rural, your actual increase will be far higher than 1%.
Always re-rate your specific shipping history. Carrier-provided “average impact” estimates rarely match real-world results.
Mistake 4: Forgetting Packaging Costs With the new cubic volume rules, switching from a 12×12×12 box to a 10×10×10 box might save you $20 per shipment in Additional Handling fees. Factor packaging optimization into your benchmarking.
Mistake 5: Overlooking Operational Costs Managing multiple carriers requires:
- Staff training on different systems
- More complex inventory allocation
- Potentially higher IT/software costs
These operational expenses can offset 2-3% of the rate savings from carrier diversification.
Tools and Resources for Accurate Benchmarking
Carrier Rate Sheets and Zone Charts Download directly from carrier websites:
- FedEx Canada rate sheets
- UPS Canada (contact for commercial rate schedules)
- Canada Post commercial rates
Shipping Calculators Most carriers offer rate calculators, but these show list rates only. Your actual negotiated rates will differ.
Transportation Management Systems (TMS) Platforms like ShipStation allow rate shopping across multiple carriers in real-time. You can see your negotiated rates with each carrier side-by-side for every shipment.
Spreadsheet Analysis Build a benchmarking spreadsheet that:
- Imports your historical shipping data
- Applies 2026 rate cards and surcharge rules
- Calculates total cost by carrier
- Flags packages that trigger new fees
Use the formulas from Steps 2-4 above to calculate dimensional weight, cubic volume thresholds, and minimum charge impacts for each package.
When to Consider Professional Optimization
DIY benchmarking works well if you:
- Ship less than 1,000 packages monthly
- Use primarily one carrier
- Have straightforward shipping requirements (single service level, no special handling)
Professional optimization makes sense when:
- You ship $10,000+ annually (approximately 1,000+ packages)
- Your shipping costs are growing faster than revenue
- You ship bulky or lightweight items affected by dimensional weight
- You serve both urban and rural markets
- You want access to enterprise rates without enterprise volume
Through Part n Parcel’s closed network, Canadian businesses access negotiated rates typically requiring $1 million+ annual shipping spend. Our network of 240+ members provides volume leverage that individual businesses can’t achieve alone.
Beyond better rates, our direct carrier relationships enable custom GRI effective dates. Members can avoid rate increases during peak shipping periods, protecting margins when volume is highest.
We’ve seen members reduce shipping costs by 15-40%. This comes not just through better rates, but through strategic carrier selection based on package profiles, automated routing rules, optimized service level selection, and strategic GRI timing.
Take Action on Your 2026 Carrier Benchmarking
The 2026 carrier rate landscape rewards businesses that move beyond simple rate card comparisons. Success requires analyzing your complete shipping profile, understanding the impact of new surcharge structures, and modeling multiple carrier scenarios.
Key takeaways:
- The 5.9% GRI is a starting point, not an endpoint. Your actual increase depends on your specific shipping profile.
- New cubic volume rules and minimum charges disproportionately affect lightweight, bulky items.
- Zone realignments create “stealth” rate increases separate from the GRI.
- All five national carriers (FedEx, UPS, Canada Post, Purolator, Canpar) plus regional (GLS) and local carriers (FleetOptics) should be evaluated based on your shipping profile.
- Total landed cost analysis must include all surcharges, not just base rates.
- Custom GRI effective dates through negotiated agreements can protect margins during peak periods.
At Part n Parcel, we help Canadian businesses navigate this complexity through direct carrier relationships, enterprise-level rates, and automated shipping optimization. If your shipping costs are growing faster than your business, we can provide a free analysis of your specific shipping profile against 2026 carrier rates.
Our pay-for-performance model means you only benefit when you achieve measurable savings. Get your free shipping analysis to see your potential cost reduction across all five national carriers plus regional and local alternatives optimized for your business.